User interface
This page provides an overview of the J-AST user interface. Once you are familiar with the layout, follow the sub-pages of this section to learn the full workflow from project creation to analysis.
Project list
When you open J-AST, you are greeted with the project list. It displays all projects associated with your account in a table sorted by last modification date.
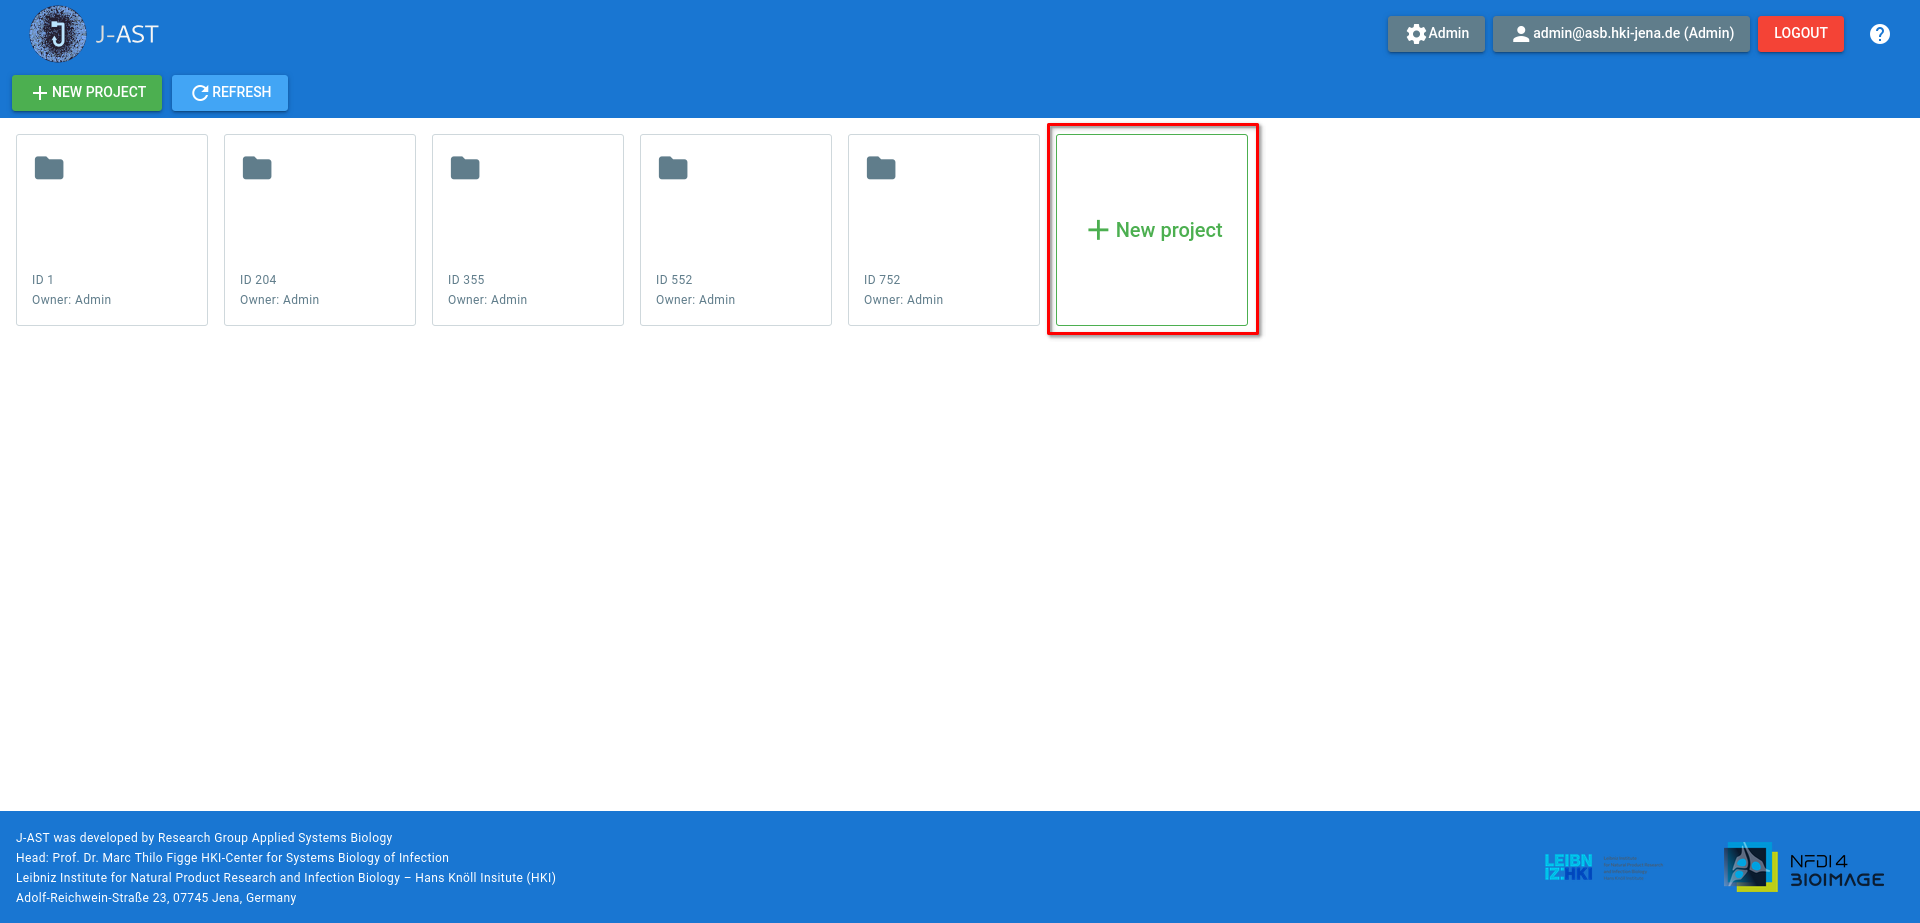
From here you can:
Create a new project via the button
Open a project by clicking its row
Delete a project via the delete icon in the actions column
Search and filter projects by name
Refresh the list via the button
For details on creating projects, see Creating projects.
Project view
Opening a project takes you to the project view, which is the main workspace for managing, annotating, and analyzing your images. The view consists of a top toolbar, a central canvas, and side drawers.
Top toolbar
- Project dropdown
Shows the project name and provides access to:
— opens the single-image browser
— switch between Timeline and Single images view modes
— rename the project
— delete the project
- UPLOAD (green)
Toggles the left-hand upload panel on and off. See Uploading files.
- Download (green)
Provides options to download selected or all images, export the project as an archive, or download raw images.
- Select all / Deselect
Selects or deselects all images in the current view.
- Filter
Toggles a filter bar where you can search by text and apply quick filters such as "No plate", "No disk/strip", or "No ZOI shape".
- Results (cyan)
Opens the results list, showing analysis outputs. A badge indicates the number of new results.
- Tasks (cyan)
Opens the task log viewer. Shows the number of currently running tasks with success/failure indicators.
Canvas: Timeline vs Grid view
The canvas displays your images in one of two view modes, which can be switched at any time via the project dropdown:
- Timeline view
Organizes images into a grid of rows and columns. Each row represents a timeline (an experiment/sample combination), and columns represent time points. Unsorted images appear in a dedicated drawer at the top. Drag-and-drop is supported for rearranging.
- Grid view
Displays all images in a simple flat grid with no timeline structure. Suitable for projects where each image is independent.
Right-hand properties panel
The right-hand panel is context-sensitive and changes based on your selection:
- No selection
Shows quick-select buttons for common tasks (e.g., select all DDAs, select all without plate, etc.).
- Single image selected
Shows the Edit and Process tabs.
The tab contains all image metadata fields (file name, experiment, sample, time point, assay type, pixel size, MIC) and buttons to open the interactive annotation editor for plate, strip/disk, and ZOI shape annotations. Custom metadata key/value pairs can also be added.
The tab shows a searchable tree of all available processing and analysis operations, organized by category (Preprocessing, Plate, DDA, E-Test, Analyze, Visualize, etc.).
- Multiple images selected
Shows bulk editing controls that let you set metadata fields for all selected images at once.
Image browser
The option (accessible from the project dropdown) opens a dedicated single-image viewer. It provides a left-hand list of all images in the project with search and navigation, and the same right-hand properties panel as the project view. The center area shows the image with a toggle between the raw image and a visualization overlay.
Help menu
The button in the top-right corner opens a built-in quick handbook with expandable sections covering the entire workflow. It also contains links to this documentation and to our tutorials.
Workflow overview
The typical J-AST workflow follows these steps, each covered in the sub-pages of this section:
Sort images into timelines (timeline projects only)
Preprocess images if needed
Detect the E-Test ZOI shape (E-Test only)
Manually correct annotations if needed
Run analysis operations (see Analyzing images)